This assignment focuses on the exploration of the equation y = a sin (bx + c) and y = a cos (bx + c) using Graphing Calculator Lite Software. The amplitude, period, and phase shifts will be explored interactively. This investigation will be carried out by changing the parameters a,b, and c. To understand the effects of each parameter on the graph of the function, I will begin by changing one parameter at a time, then later I will change all the parameters at once.
Definitions and Important Terms:
Amplitude: The amplitude, a, is the distance from the midpoint to the highest or lowest point on the function. The amplitude, a, will always be |a| since distance is always positive.
Period: The period, p , is the distance between any two repeating points on the function.
Phase Shift: The amount of horizontal displacement of the function from its original position.
General form of the Sine Function is: y = a sin(bx +c) and the General form of the Cosine Function is: y = a cos(bx + c) where: a is the amplitude of the function, the period of the function is p= 2pi/b, the frequency is the reciprocal of the period of 1/p , and the phase shift of the function is equal to c/b.
Investigation 1: We will first do an investigation on how the parameter a changes the graph of y= a sin(bx+c).
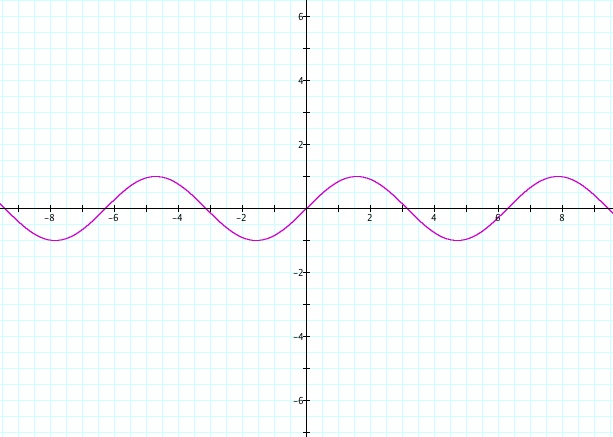
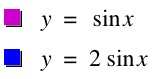
Let's graph y = sinx (where a = 1, b = 1, and c = 0)
Notice that the graph of y = sinx repeats itself as it moves along the x-axis. This property will hold for all sine and cos functions. The cycles that are repeated are called periods of the function. The period of a function can change depending on the parameters. The function y = sinx has a period of 2pi radians, and it ranges from -1 to 1 on the y-axis, thus it has an amplitude of 1.
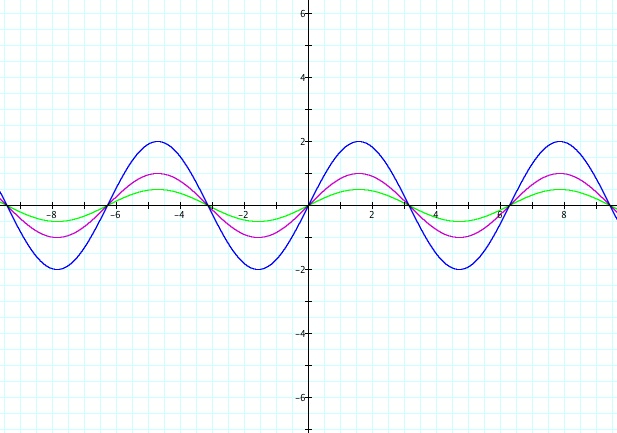
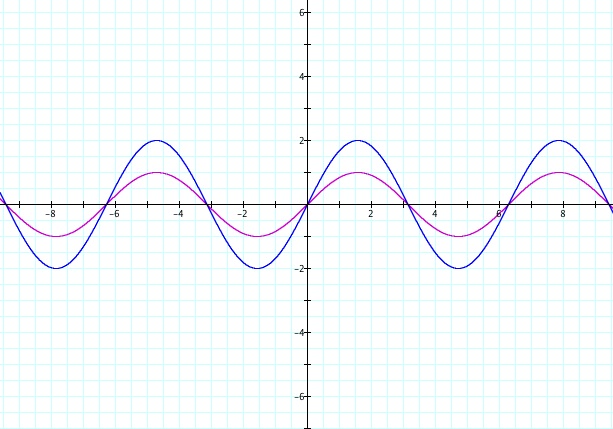
Next, on the same axes, let's graph y = 2 sinx and see the changes in the graph from the original y = sinx.
Observations: The green graph which represents the equation y = 2 sinx is vertically stretched from the original graph y = sinx. Notice that the amplitude, a, of y = 2 sin x is equal to 2, therefore, it is greater than 1.
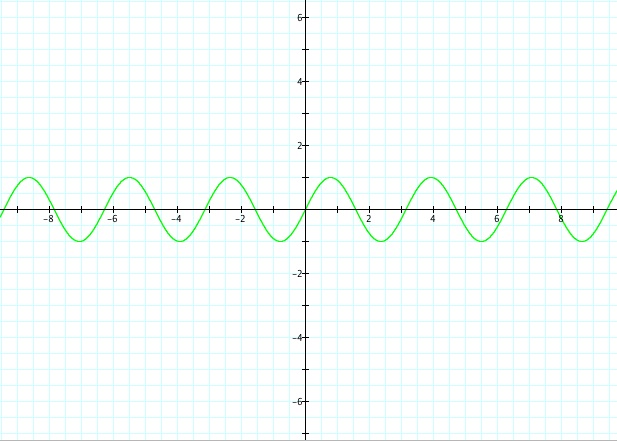
Next, let's graph y = (1/2)sinx on the same axes as the others and observe the changes.
What do you notice now when the amplitude, a, is less than 1? The graph of y=(1/2)sinx is represented by the green graph. Notice that this graph is vertically shrunk from the original graph y=sinx. It appears to be shorter than the original purple graph.
It's important to remember that these graphs are changing in "height"; however, they are not changing horizontal width. The graphs are still drawn from 0 to 2pi.
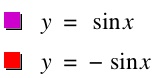
Now, let's examine the graphs y = sinx and y = -sinx on the same axes.
Observations? From the graph you can see that y = -sinx (represented in red) is the reflection over the x-axis of the equation y = sinx.
Finally, let's graph y = n sinx and let n vary from -5 to 5. See animation below.
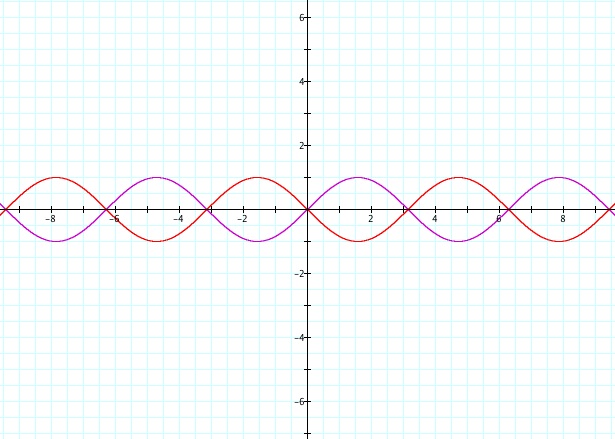
What do you notice about the changes that the parameter n has on the original graph y = sinx? From the animation, you can see that the function y = nsin x is vertically stretched or vertically shrunk by the variable n. Will changing the amplitude, a, in the cosine function cause the same changes? Let's explore the cosine function by graphing y = cos x, y = -cos x, and then y = n cosx letting n vary from -5 to 5.
As you can see from the graphs, they look almost identical. However, let's observe what effects n has on the graph, view the animation below.
Notice that the graph of y = n cosx behaves the same as the function y = n sinx.The parameter n in the function y = nsinx causes the graph to vertically stretch or vertically shrink by the absolute value of n.
Investigation 2: Now, let's focus on how the parameter b affects the graph of y = asin(bx + c).
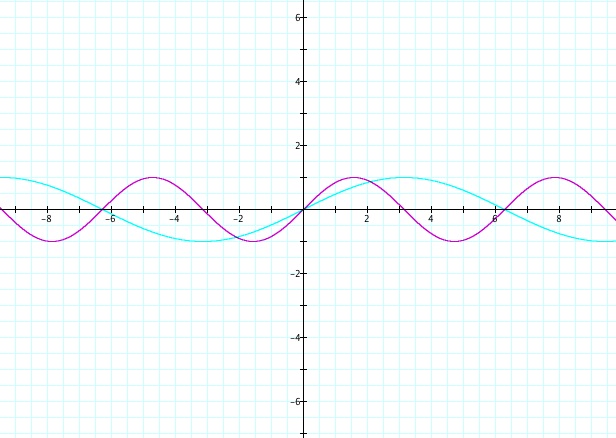
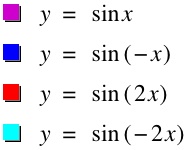
The parameter b essentially changes the period of the function. In the original graph of y = sin x we see the cycle repeats every 2 pi units. To study the period of the sine function, let's set a = 1 and c = 0. Looking at the graphs below, notice what happens when y = sin x is changed to y = sin 2x. As you can see, the 2 has the effect of shortening the wave length or period. Thus, waves appear on the graph twice as frequently as in y = sinx. In the graph below there are 6 complete waves in a distance along the x-axis of 6pi. Therefore, the period or length of one wave will be 6pi/6 = pi. The frequency, or the reciprocal of the period, will be 1/pi.
Let's look at the graph of y = sin (1/2)x in relation to the graph of y = sinx below.
What is happening in this graph? If I was performing these investigations in a high school classroom, I would ask my students to make a prediction about what happens to the graph y = sin bx as b is varied before continuing any more examples of graphs. As you can see, if b = 1/2 then it takes 4 pi units to complete a full period which is twice as long as the period for y = sinx which is equal to 2pi. Let's do a few examples with b being less than zero, i.e. having a negative value.
From the graph above, we see that a negative b value will also cause a reflection across the x-axis in the sine function. Next, let's take a look at the cosine function and see how the value of b affects it.
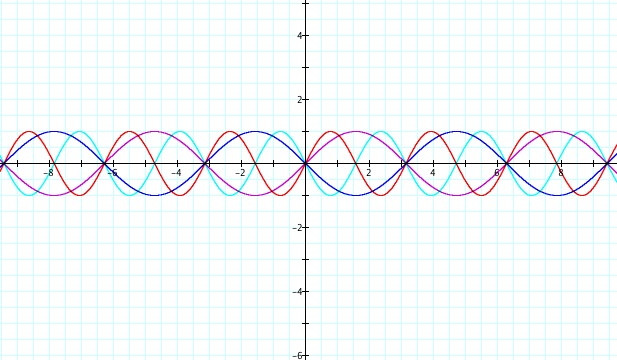
Let's first begin by investigating positive b values greater than or equal to one.
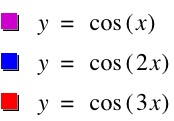
From this graph, we can see the period has definitely changed just like in the sine function. The period of cos(2x) is equal to 2pi/2 = pi. The period of cos(3x) is equal to 2pi/3.Now let's try some negative b values and observe what happens to the period of the cosine function.
Notice that y = cos(x) is the same graph as y = cos(-x). The graphs simply just lie on top of each other, thus the negative b value doesn't affect the graph of the cosine function. This is a very important property about the cosine function. cos(x) = cos(-x) implies that the cosine function is an even function. You may not know what it means for a function to be even or odd, but these are two very important concepts. A function f is said to be an odd function if for any number x, f(-x) = - f(x), and a function f is said to be an even function is for any number x, f(-x) = f(x). Therefore,
sine is an odd function because:
sin (-x) = - sin (x)
and cosine is an even function because:
cos(-x) = cos(x)
These facts follow from symmetry of the unit circle across the x-axis. The angle -x is the same as angle x except it is a reflection of angle x over the x- axis (i.e. -x is on the other side of the x-axis.) Taking a point (x,y) in the first quadrant and flipping it across the x-axis to the fourth quadrant makes it (x, -y), so the y- coordinate is negated, that is, the sine is negated, but the x-coordinate remains the same, that is, the cosine is unchanged.
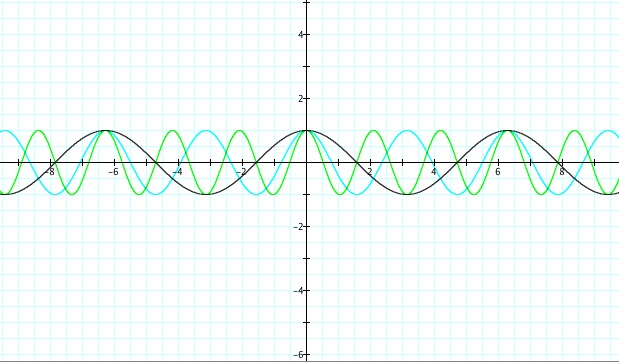
Now, let's look at b values that are greater than zero but less than one.
From all of these graphs, it is easy to see that the b value affects the period of the cosine function as well. In fact it takes 1/b times to complete a period of a curve. If b is equal to 1, then it takes 2pi to complete a period. If b is equal to 2, then it takes only pi to complete a period. If b is equal to 3 we notice that there are 9 complete waves in a distance along the x-axis of 6pi, thus the period is 6pi/9 = 2pi/3. If b is equal to 1/2, then it takes only 4pi to complete a period which is twice as long as the period for y = cos x.
The period of a sine or cosine function is found by the equation p = 2pi/b or b = 2pi/p.
Investigation 3: Changing the values of the variable c and how it affects the graph. Once again we will fix a = 1 and b = 1.
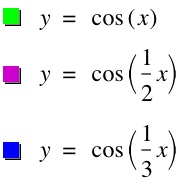
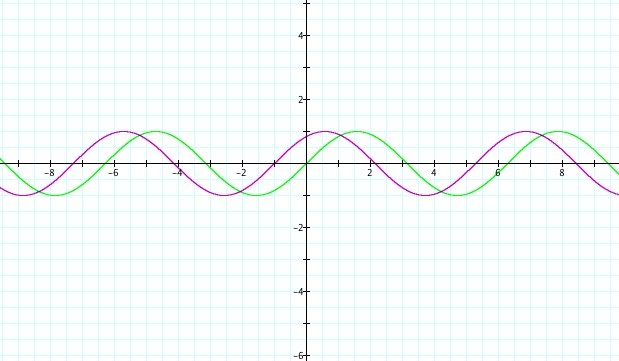
We can see from the graph above that the function y = sin (x+1) moves horizontally to the left along the x-axis from the original graph of y = sinx. Let's explore more variations in the value of c.
From the graph above, we can see that the actual picture of the graph does not change at all, it only shifts. If c is a positive value it shifts c units to the left of the original function, if c is negative it shifts c units to the right. Thus, c affects the horizontal displacement (or shift) of the graph.
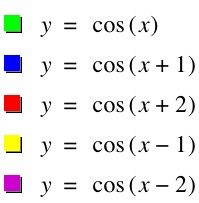
Now let's explore the cosine function and how the variation of the parameter c affects the graph. Does the parameter c effect the cosine function the same as the sine function?
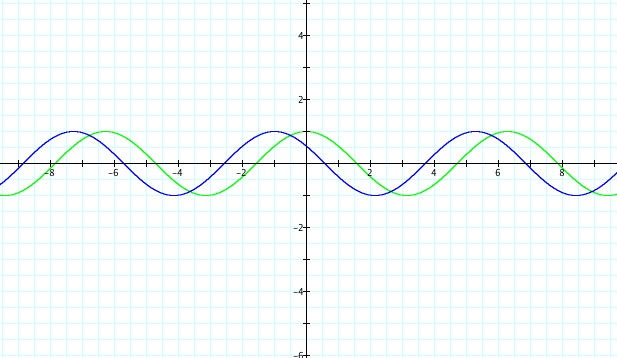
We can see from the image above that the graph of the function y = cos (x+1) causes a horizontal shift to the left along the x-axis. Let's explore more variations of the value of c.
Just like with the sine function, we can see that the actual picture of the cosine graph does not change, it only shifts. If c is a positive value, it shifts c units to the left, if c is a negative value it shifts c units to the right. Thus, c affects the horizontal displacement (or shift) of the graph just as it does in the sine function.
Investigation 4: Varying a,b, and c at the same time.
Look again at the equation y = a sin(bx + c) and the equation y = a cos(bx+c). Notice that we have varied a, the amplitude, and varied b, the period, and varied c, the phase shift. Now it's time to vary all three parameters at the same time. Let's begin by graphing y = sinx and graphing y = 3 sin(2x +1) on the same axes.
Notice the new graph has an amplitude of 3, the period is 2pi/b = 2pi/2 = pi, and the phase shift is one unit to the left.
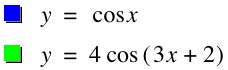
Now, let's vary all three parameters at the same time in the cosine function. Let's graph y = cos x and graph y = 4* cos(3x+2) on the same axes.
Notice the parent function, y = cos (x) has an amplitude equal to 1, a period of 2pi units, and has no phase shift. The new graph y = 4 cos(3x + 2) has an amplitude equal to 4, aperiod of 2pi/b = 2pi/3 units, and has a phase shift of 2 units to the left.
More explorations:
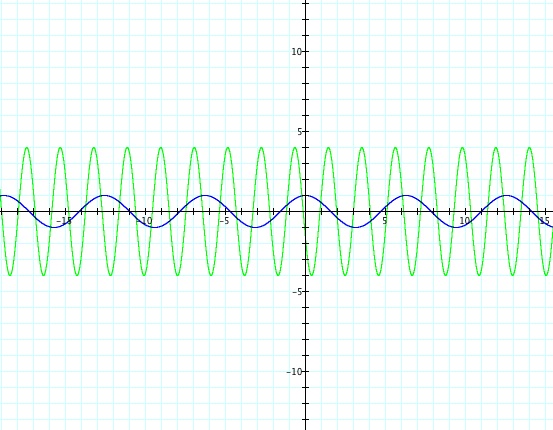
What will happen if all the coefficients are negative? Look at the graph below to see y = -4 sin (-1/2 x -5). Can you observe what is happening in this graph? Would the graph of the cosine function be any different? If so, how?
Extension: To continue this lesson in a future classroom, I will ask my students to find the equation of a sine or cosine function given the amplitude, period, and phase shift instead of looking at a graph. Also, I will ask the students to find the period and amplitude of a given function, then graph it. It is important for students to be able to look at a graph and determine the amplitude and period of a function by inspection and then write the equation that satisfies the graph. Also, for further exploration, it might be a good idea to have students explore the properties and graphs of y = a tanb(x-c) + d , y = a cotb(x-c)+d, y = a cscb(x-c)+d, and y =a secb(x-c)+d. This would be a fun, interactive activity to engage all learners.
.jpg)
.jpg)
.jpg)
.jpg)
graph.jpg)